by Ger Cloudt, author of “What is Software Quality?”
When considering the core activities of a software development team, typical one would come up with the following activities; requirements engineering, design & modeling, coding & unit testing, functional testing, system testing, acceptance testing, and not to forget configuration management and tool management & support. However, it seems to be that on average a developer creates ~70 bugs per 1000 lines-of-code of which ~15 will find their way to the user of the software[1]. This implies there is another, not yet mentioned, important and time consuming activity to be performed by a software development team; debugging.
Simply stated, debugging are the activities performed to root-cause and resolve a malfunction of the software, or in short, solving that bug. Debugging might be one of the most underestimated activities of a software development team. According to Coralogix[1], solving a bug takes 30 times longer than writing a line of code. Reason enough to have a closer look to debugging, I would argue.
Execution Paths
Source code is executed sequentially by the CPU; the order in which the different statements are executed is referred to as the execution path. The figure below depicts the elementary execution paths for the possible control flows in source code.
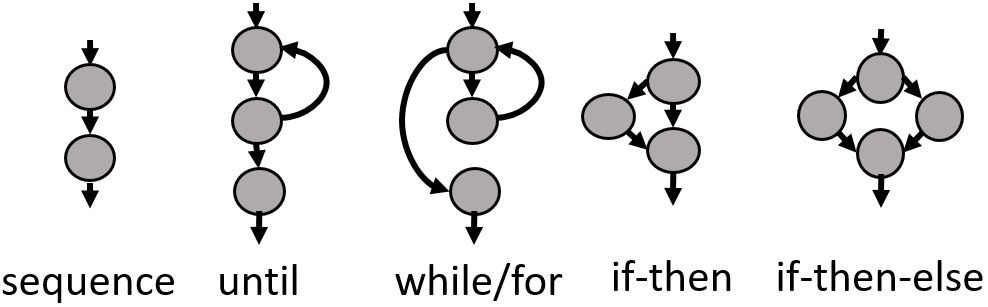
Each circle is called a node and represents a statement. The arrows between these nodes are called edges and signify possible control flows. As an example, whenever an if- statement evaluates a condition, it continues in either direction (one of the two edges) depending on the outcome of evaluating the condition. Thus, an if-then or an if-then-else statement has two possible execution paths.
The following figure shows a small program of an algorithm which searches for the smallest minimum number in both sorted arrays in addition to the visualization of the possible execution paths through this program’s code.
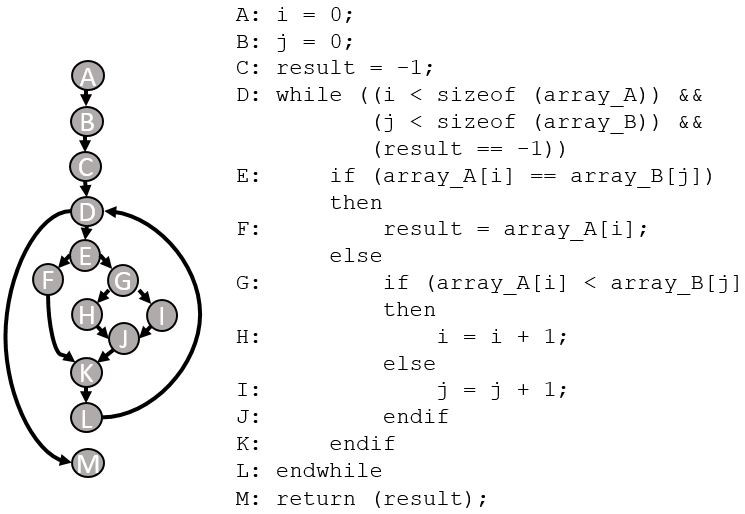
Whenever we would execute this program with the following input data:
array_A = {1,2,4,6,8}
array_B = {2,3,5,6,7,8,10,11}
the following execution path would be executed resulting in the correct outcome “2”.
A,B,C,D,E,G,H,J,K,L,D,E,F,K,L,D,M
Let’s insert an error
When there is a bug in the software in most cases a not-expected execution path is executed, like if we would enter an error in the small program above by replacing statement E by
“if (array_A[i] != array_B[j])”
The execution path with mentioned input data would become
A,B,C,D,E,F,K,L,D,M
resulting in the wrong outcome “1”.
Debugging therefore focuses on understanding what execution path is executed in this error situation and where it differs from the expected execution path. To do so, one needs to have insights in the values of the different variables in the code at different stages in the execution to understand why certain decisions during execution are made. Debug tooling may support this process by the ability to set break points, step statement-by-statement through the code and examine values of variables at any required time. Whenever the actual not expected execution path is identified, the engineer needs to understand why this unexpected execution path was executed before the bug can be fixed.
Scope matters
Debugging a bug in the example in this article would be relatively simple due to the scope of the problem. In this program we only have 1 function consisting of 13 lines-of-code taking less than ½ page of paper if printed. A minimum scope which decreases complexity of debugging.
But how about a medium scope consisting of multiple functions like in the following figure? Here we have a visualization of execution paths of 11 functions consisting of 99 lines-of-code, which would take ~3 pages of paper if printed.
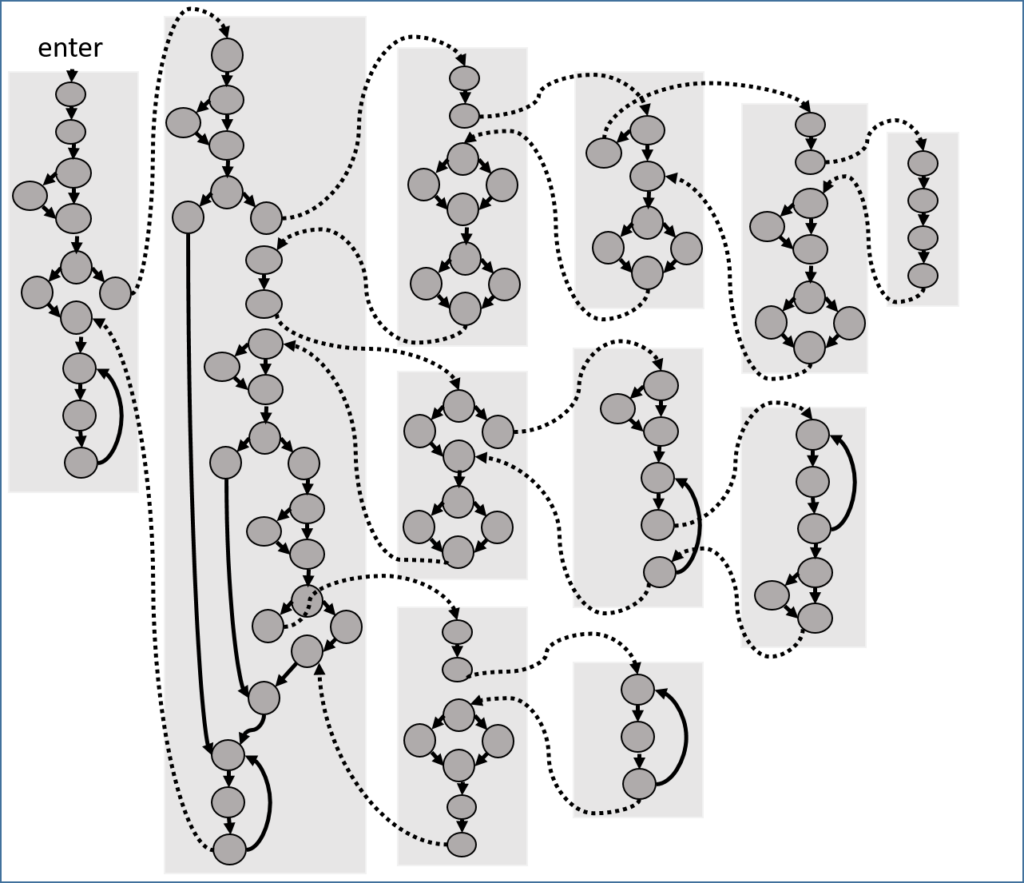
Somewhere in this code there is a bug……. As you can imagine it will be more complex to debug and find out where the bug is located, it could be anywhere.
And how about a bug detected during system testing or by a customer while running the complete software program? A large scope consisting of e.g. 100,000 lines-of-code? Thousands of functions and when printed being an equivalent of a pile of books like in the picture below.
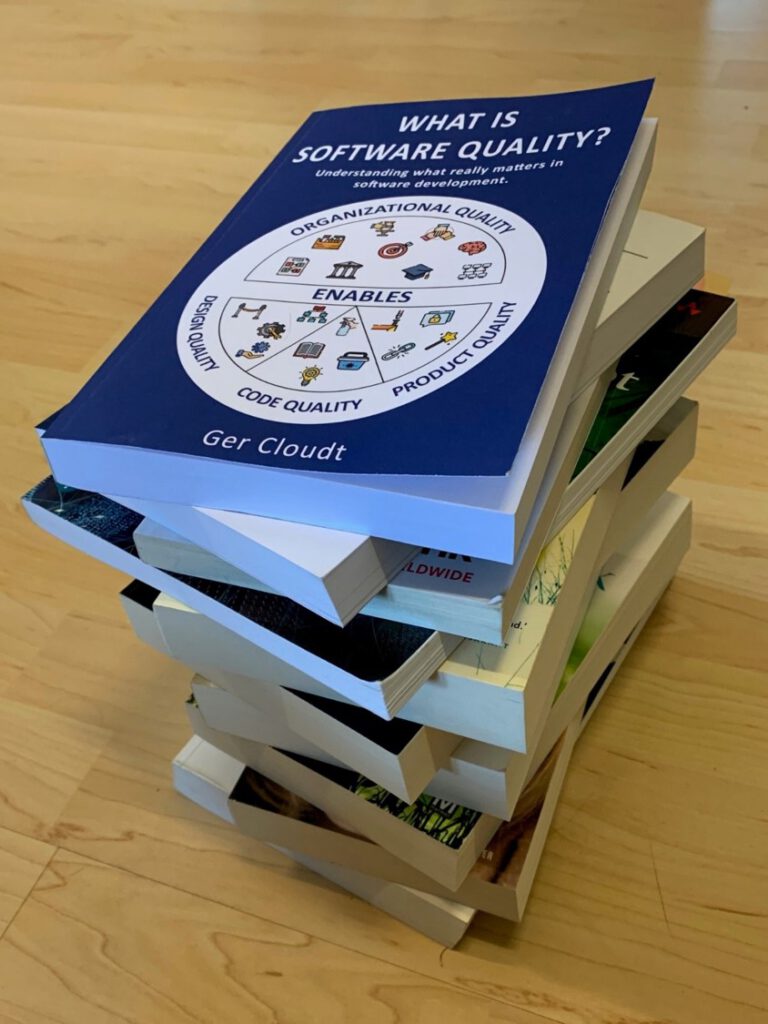
Somewhere in this code there is a bug……. It can be anywhere, in any book, in any chapter on any page. You can imagine that debugging in a large scope is much more complex than having to consider a medium scope or, even better, a minimum scope only. As modern software programs are even much bigger than the represented pile of books in the picture, it becomes evident that we should focus on finding bugs in smallest scope as possible. That’s why engineers should focus on unit testing, in which the scope is the smallest one, and try to catch the majority of bugs. Only a few bugs should find their way into component or module testing and even less should find their way into system and acceptance testing, simply because debugging becomes more complex when scope increases.
[1] https://coralogix.com/log-analytics-blog/this-is-what-your-developers-are-doing-75-of-the-time-and-this-is-the-cost-you-pay/